Health Overview
Written By GoCSM
Last updated About 1 month ago
The Overview page in GoCSM gives you a high-level summary of your entire agency's health. This is your agency-wide command center for monitoring performance, identifying trends, and taking action across all accounts.

What You Will See
Overall Health Score
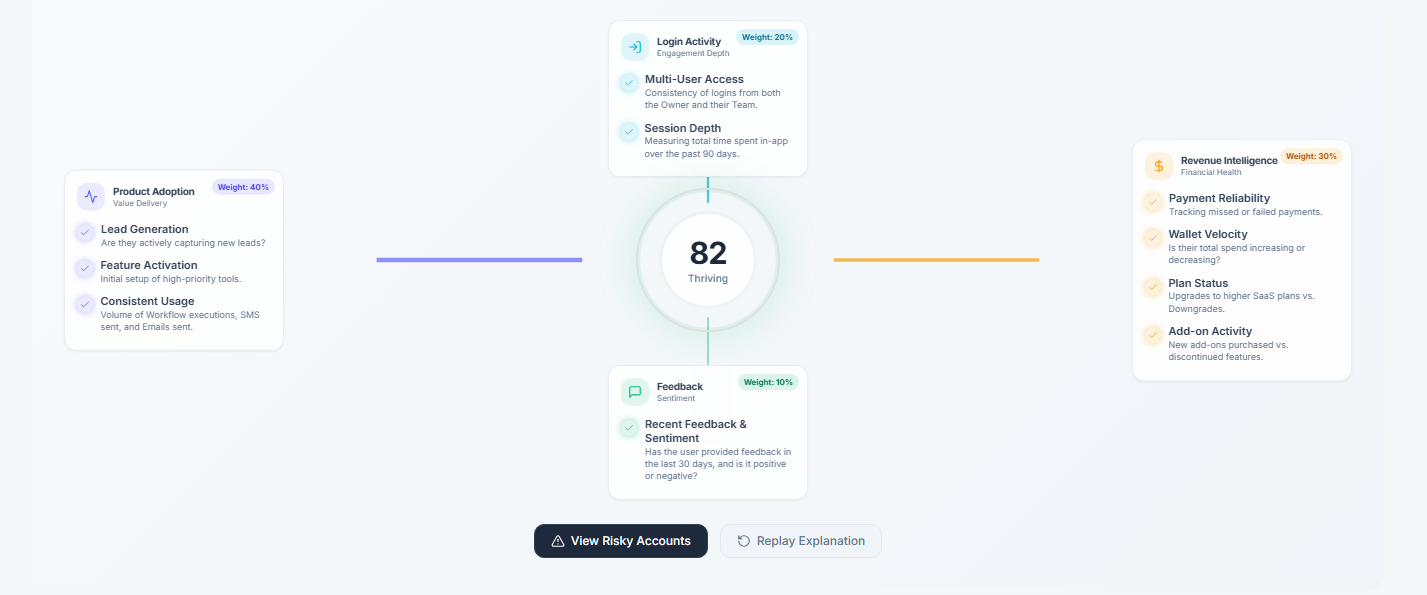
At the center of the page, you will see your agency's overall health score, representing the combined performance of all tracked accounts. You will also see a visual breakdown across the four pillars: Product Adoption, Revenue Intelligence, Login Activity, and Customer Sentiment. This pillar-level view lets you quickly identify whether issues are driven by adoption gaps, revenue problems, engagement drops, or negative client feedback.
Health Distribution
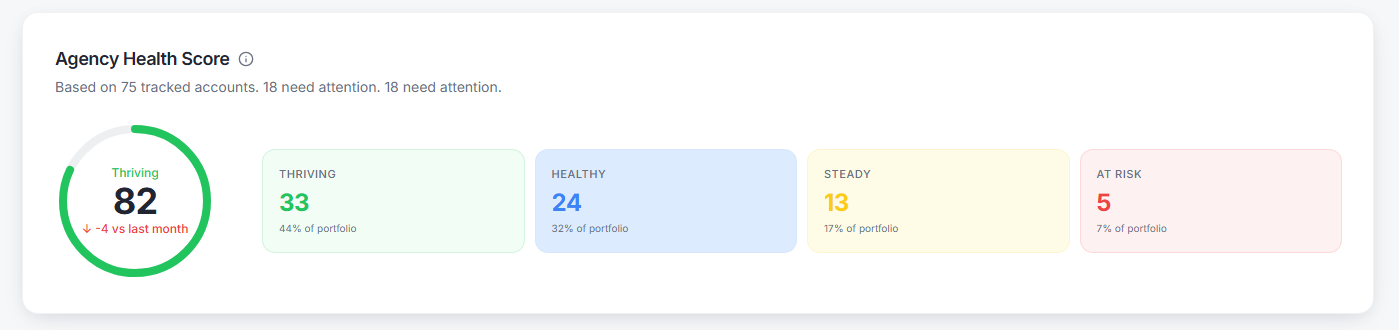
A breakdown of how your accounts are distributed across the four health bands: Thriving (80-100), Healthy (60-79), Watch (40-59), and At Risk (0-39). This gives you an immediate read on the state of your portfolio and helps you understand the overall balance between healthy and at-risk accounts.
Key Metrics
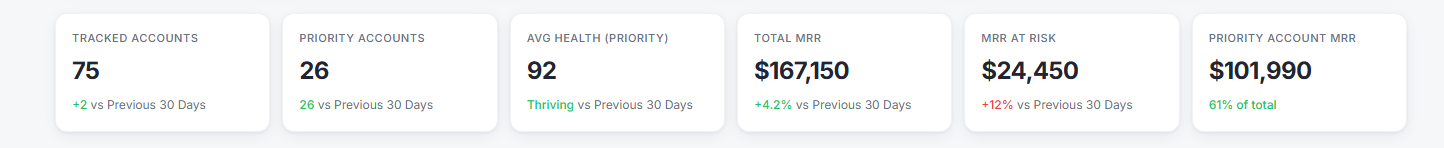
The dashboard includes:
Total tracked accounts
Priority accounts
Total MRR
MRR at risk
Priority account revenue
These metrics give you a financial lens alongside the health data, so you can weigh account risk against revenue impact when deciding where to focus.
Accounts Requiring Attention
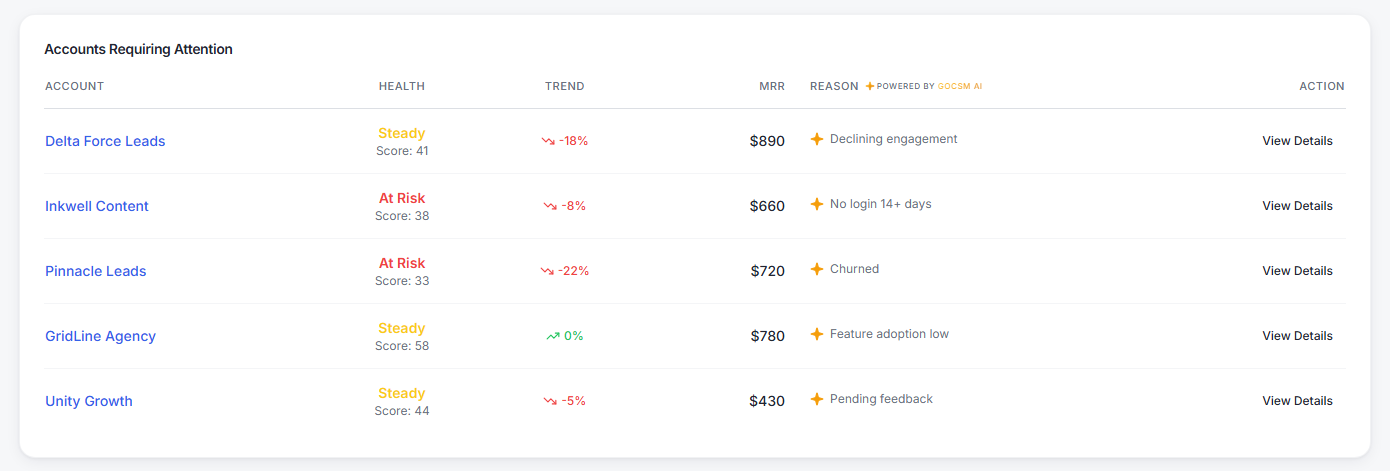
A prioritized list of accounts that need immediate focus. For each account you will see the name, health score and band, trend direction, and the reason it is flagged. Use this as your starting point each day to ensure the highest-impact accounts get addressed first.
Health Trend
A historical graph showing how your overall health score has changed over time. Use this to track improvements after interventions, identify sudden drops that require investigation, and measure the long-term impact of your customer success efforts.
Top Performing Accounts

Your best-performing accounts, highlighted for upsell opportunities, testimonials, and case studies. These are the accounts in the Thriving band that represent expansion revenue potential and proof points for your agency.
How to Use the Overview Page Strategically
Run a 5-Minute Daily Scan
In one quick pass:
Look at your overall score trend
Check if At Risk accounts increased
Scan MRR at Risk
If anything changes significantly, investigate immediately.
Identify Where the Problem Is
Look beyond the overall score and identify which pillar is declining. Example:
Revenue drops but usage is strong → likely a billing issue
Usage drops but revenue is stable → hidden churn risk
Use Accounts Requiring Attention as Your Task List
Treat this section like a priority queue. Work from top to bottom, focusing on accounts with both low health and high MRR.
Track Impact Over Time
After taking action, monitor the Health Trend graph. Look for improvement within 7 to 14 days. If there is no improvement, adjust your approach.